If you’ve ever stood on the floor of a hydraulic system design room, you know that an ATOS pump isn’t just a lump of metal that pushes fluid. It’s a precision tool, and to get the most out of it, you have to learn to read its flow characteristic curve. When I’m working with new customers—from small machine shops to large automation integrators—this is the first thing I walk them through, because misinterpreting that curve is one of the most common mistakes I see, and it’s one that leads to inefficiency, unexpected downtime, or even premature pump failure. ATOS Pump
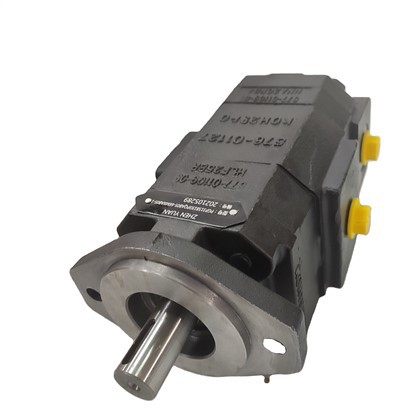
Let me start with a quick disclaimer: I’ve been an ATOS pump supplier for 12 years now, and I’ve sold hundreds of these units. I’ve seen a customer buy a pump based on a catalogue number alone, install it, and wonder why their system runs at 30% less capacity than what they expected, all because they didn’t understand the flow curve. That’s why this matters. It’s not just about numbers on a page—it’s about making sure your hydraulic system works the way you need it to, for as long as you need it to.
First, let’s define what a flow characteristic curve is, specifically for ATOS pumps. Most hydraulic pumps are positive displacement, right? That means they move a fixed volume of fluid per revolution, assuming there’s no leakage. But in the real world, leakage is unavoidable. As pressure increases, the clearances between the pump’s internal components—like the gear teeth in a external gear pump, or the vanes in a vane pump, or the pistons in a axial piston pump—expand slightly under pressure, and some fluid leaks back to the inlet side instead of going to the outlet. That leakage is directly proportional to pressure, so the flow rate of the pump drops as pressure goes up. That’s the shape of the ATOS flow curve you’ll see on every datasheet.
Let’s break down the axes first, because if you mix those up, you’ll get the wrong idea. The X-axis is almost always operating pressure, measured in bar (or sometimes psi, but ATOS uses bar for most of their international units) from 0 up to the maximum pressure the pump can handle. The Y-axis is flow rate, in liters per minute (L/min) or gallons per minute (GPM), measured at a given rotational speed—important, because all flow curves are tied to a specific RPM, usually 1500 or 1800, the standard for 50Hz or 60Hz power grids, respectively. I always tell customers to double-check the RPM on their curve, because if you run the pump faster, flow goes up, and if you run it slower, flow goes down; the curve’s shape stays the same, just shifted up or down.
Now, the most important point on that curve is the maximum flow at zero pressure. That’s the theoretical flow rate the pump would deliver if there was no backpressure—sometimes called the “no-load flow.” But here’s where a lot of customers go wrong: they see that number as the flow they’ll get in their system. No way. Because every hydraulic system has some pressure, even if it’s just the pressure needed to push fluid through the hoses and valves. For example, if you’re powering a hydraulic press that runs at 100 bar, your actual flow rate will be a little less than that zero-pressure number.
Next, the curve’s slope. That’s how fast the flow drops as pressure increases. ATOS pumps are known for tight manufacturing tolerances, so their flow curves are much flatter than cheaper, generic pumps. Let me give you a real example: last year, a customer was choosing between an ATOS axial piston pump and a competitor’s model for a metal stamping line. The competitor’s curve showed a drop of 8 L/min between 0 and 200 bar, while the ATOS curve only dropped 3 L/min. At their operating pressure of 180 bar, that meant the ATOS pump delivered 5 extra L/min of flow. For their stamping cycle, that cut their cycle time by 1.2 seconds per part, which added up to 120 more parts per hour. That’s not a trivial difference—that’s the value of understanding the slope of the flow curve.
Then there’s the endpoint of the curve: the maximum operating pressure, also called the rated pressure. That’s the highest pressure the pump can run at continuously without damaging internal components. You’ll also see a peak pressure, which is the short-term maximum, like for a press stroke, but you almost never want to run your pump at peak pressure for long. A lot of times, I see customers operating their pumps at 95% of rated pressure, and that’s a fast track to wear. The flow curve will flatten out near the rated pressure, meaning you get almost no extra flow for a huge increase in pressure, so it’s inefficient, and you’re shortening the pump’s life.
Wait, let’s also talk about variable displacement pumps, because a lot of ATOS pumps are this type—they adjust their displacement based on pressure or load, right? The flow curve for a variable ATOS pump is a little different. Instead of a continuous drop with pressure, it has two parts: the first part is the constant flow range, where the pump is at maximum displacement, so the curve is flat (same as a fixed displacement pump) until it hits the pre-set pressure. After that, the pump reduces its displacement to maintain that pressure, so the flow curve drops off sharply. That’s a game-changer for energy efficiency, because the pump doesn’t deliver more flow than the system actually needs. I had a food processing client a couple years back who switched from fixed displacement pumps to ATOS variable pumps, and their electricity bill for the hydraulic system dropped by 28% in the first quarter. That’s a direct result of understanding how the variable flow curve works.
Let me walk you through how to use this curve to size your pump correctly, because that’s the biggest application. Suppose you need a pump that delivers 40 L/min at 120 bar for your application. First, you look at the ATOS flow curve for your desired RPM. If the curve at 120 bar is 39 L/min, that’s perfect—close enough. But if the curve at 120 bar is only 35 L/min, you need to either bump up to the next larger pump size, or adjust your operating pressure (if your system can run a little lower pressure, that will boost flow). Also, don’t forget to account for temperature! Hydraulic fluid gets thicker when it’s cold, and thinner when it’s hot. Cold fluid increases leakage, so flow drops more at low temperatures; hot fluid reduces leakage, so flow is closer to the zero-pressure number. The datasheet will usually have a curve at 40°C, which is the standard operating temperature, but if your system runs at 60°C, you can expect about 2-3% more flow than the curve shows, and if it’s at 20°C, 4-5% less. That’s a detail a lot of design engineers miss, and it leads to undersized pumps.
Another common question I get: why does the flow curve sometimes differ from the datasheet when the pump arrives? It’s not that the pump is bad. Manufacturing tolerances are tight, but there’s always a tiny bit of variation between individual pumps. ATOS tests every pump before it leaves the factory, so the curve printed on the datasheet is an average, not an exact number for that specific unit. If your pump’s measured flow is 1-2% different from the curve, that’s normal. If it’s more than 5% off, you should check for system issues—like a leak in the lines, or a pressure relief valve set too low— not the pump, usually.
I’ve also seen customers confuse flow curves for different pump types. For example, external gear pumps have a steeper flow curve than vane pumps, which have a steeper curve than axial piston pumps. So when you’re comparing different pump technologies, you can’t just look at the zero-pressure flow number—you have to compare at your actual operating pressure. Let’s say two pumps both have a zero-pressure flow of 50 L/min. One is a gear pump, whose flow drops 10 L/min at 150 bar, and one is an ATOS vane pump, whose flow drops 4 L/min at 150 bar. The vane pump will deliver 6 extra L/min at 150 bar, which is enough to make your system work faster, or let you use a smaller motor, saving on energy costs. That’s why ATOS’s focus on tight internal tolerances makes their flow curves so reliable.
Now, a few pro tips from 12 years in the business. First, always get the flow curve specific to the pump model and RPM you’re using—don’t use a general curve for a different model. Second, if you’re working with a variable displacement pump, pay attention to the power curve that’s often included with the flow curve. It will show you the input power needed at each pressure, so you can make sure your motor is sized correctly. Third, when you’re testing a new pump, take flow measurements at your system’s actual operating pressure, not just at zero pressure. A quick test: hook up a flow meter after the pump, run the system at normal load, and compare it to the curve. If it’s off, check for leaks first, before assuming the pump is defective.
At the end of the day, the flow characteristic curve isn’t just a marketing graphic or a technicality—it’s a tool to get the best performance, longest life, and lowest cost from your hydraulic system. Whether you’re a design engineer sizing a new machine, a maintenance manager troubleshooting a slow cycle, or a production manager looking to cut energy costs, understanding that curve will save you time, money, and headaches down the line.

If you’re working with ATOS pumps and need help interpreting your flow curve, or you’re in the market for a new ATOS pump and want to make sure you’re getting the right unit for your application, get in touch to discuss your specific requirements. We can walk you through your datasheet, compare options based on your operating pressure and flow needs, and make sure you pick the pump that will work best for your system.
PARKER Pump References
ATOS Hydraulics. (2020). Product Manual: Positive Displacement Pumps and Flow Characteristics. ATOS S.p.A.
Merle, L. (2018). Hydraulic Pump Technology: Flow Characteristics and System Efficiency. Industrial Press.
Taylor, R. (2021). Sizing Hydraulic Pumps Using Flow Curves for Industrial Applications. Journal of Fluid Power Engineering, 42(3), 45-52.
Fujian Zhenyuan Hydraulic Equipment Co., Ltd.
Fujian Zhenyuan Hydraulic Equipment Co., Ltd. is well-known as one of the leading atos pump manufacturers and suppliers in China. If you’re going to wholesale atos pump in stock, welcome to get quotation from our factory. All customized products are with high quality and low price.
Address: No. 125, Wuli Industrial Zone, Jinjiang, Quanzhou City, Fujian Province
E-mail: yexun@fjzhenyuan.com
WebSite: https://www.zhenyuanhydraulic.com/
